Machine Learning
The images below come from screenshots of an analysis I wrote on Kaggle in R Markdown Language. They are a market basket analysis of shopper data provided by Kaggle. There was an issue with this dataset in that each row contained the item purchased, the member ID of the customer that purchased the item, and the date of purchase. To create a "basket" of purchases, I combined the member ID and the date into a single field called transaction ID. Of course, this step assumes that no customer shopped at the store more than once on any given day. Even if when this assumption is invalid, however, it is likely that the customer intended to purchase all of the items at once. Once the transaction ID field was created, a new dataset was created with just transaction ID and item name. From this, the arules package allows us to convert this to a list of transactions which can then be processed to get the rules.
The first image shows some of the rules generated by the analysis, showing what products tend to be purchased with what other products.
The second image defines the terms used in market basket analysis.
The third image shows a top 10 list of purchased items at the store.
The fourth image shows some of the most important product combinations. For instance, we can see that when sausage and yogurt are purchased together, whole milk is more likely to be purchased than can be accounted for by pure chance (lift > 1).
The other problem with the analysis of this dataset is its small size. To get any sort of meaningful rules, that occur more often than pure chance, we have to adjust the parameters in such a way that there aren't many hits for any particular rule. For instance, the sausage, yogurt, whole milk rule just mentioned only occurred 22 times in the entire dataset. This activity was good practice, but to get meaningful results, much more data would need to be collected.


For my capstone project, I chose to use a dataset from a fictitious cell phone company to predict customer revenue. The full training dataset was split (80/20) into a training set and a validation set. A separate testing set was supplied later.
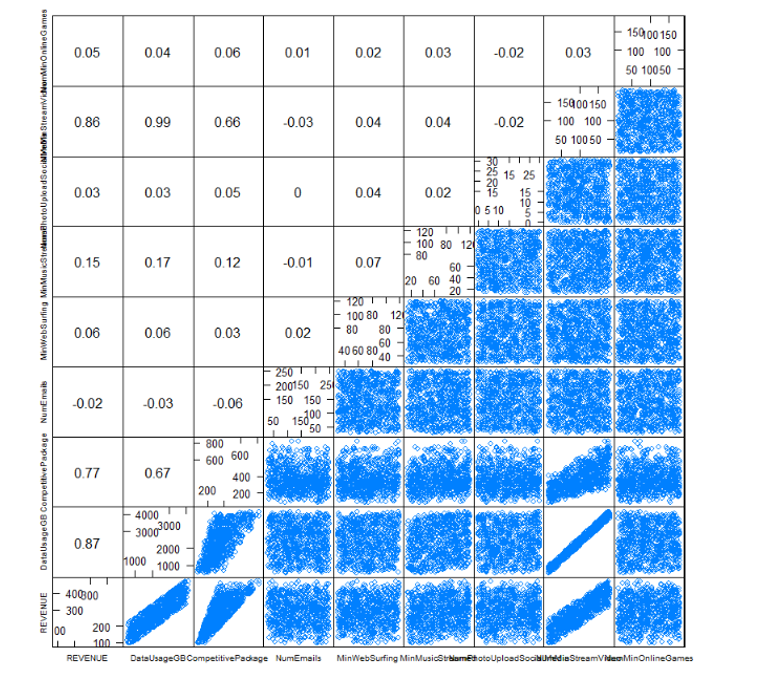
The first image below shows a correlation grid between revenue and a selection of variables in the dataset. A close correlation can be seen here between revenue and three of the variables: data usage, price of comparable plans at other carriers, and number of minutes of streaming video. Also, as expected, a very tight correlation can be seen between data usage and amount of streaming video downloaded. In the end, streaming video did not add anything to the model, which was trimmed to just two variables.
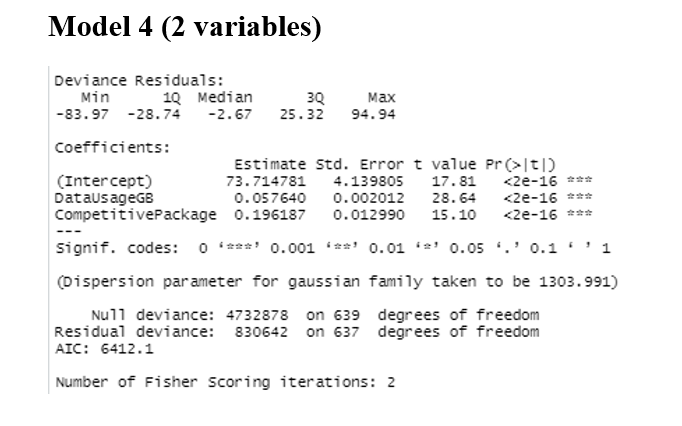
The second image shows R output of a linear regression analysis on the chosen variables.
The third image shows the results of using the model on the validation dataset. This plot is from a custom function that I created to compare predicted vs. observed values in regression models.
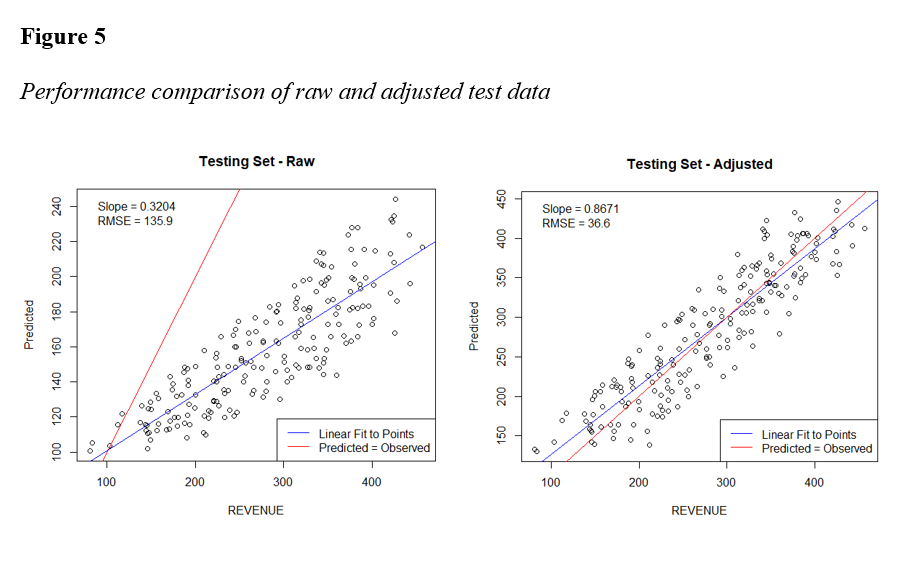
The final image shows two plots. Upon initial application of the model on the testing dataset, the plot on the left was observed. After some analysis, however, I concluded that there was an error in either the training/validation data or in the testing data, as the data usages were different by about a factor of 10. Based on this analysis, I decided to multiply the data usage values in the test dataset by a factor of 10. The plot on the right of this image was the result. This assumption and adjustment were included in the report. Because I did not have access to the original data source, I could not conclude which set of data was in error. I stated this in the report, saying that the source of the variance would need to be identified before the model could be deployed.
The full capstone report can be found on my OneDrive public account and the presentation given at the end of the course is included on the Presentations page of this website and on my OneDrive account.

Drop me a line and we can talk. It can be about a job, or a discussion of the website, or just the start of a beautiful friendship.