Writing Samples

I started writing on Medium for a variety of reasons. Partly, it was in the hopes of making a little bit of money. Partly, it was to focus my personal learning, since it is often said that the best way to learn something is to try to teach it to somebody else. And, finally, it's partly to teach others some of the various aspects of data analysis. This is a bit of carryover from my days as a teacher and tutor. Shown here are four articles I have written for Towards Data Science, a data science publication on Medium.com.
The first article below describes how to use the Rattle package to help teach yourself how to use R. The Rattle package is a GUI interface for running machine learning tasks, which simplifies the process greatly. But the learning comes in by reading the log files. Rattle keeps a log of all actions performed, and the user can use these logs to learn how many aspects of R are performed, from data cleaning to using models to make predictions.
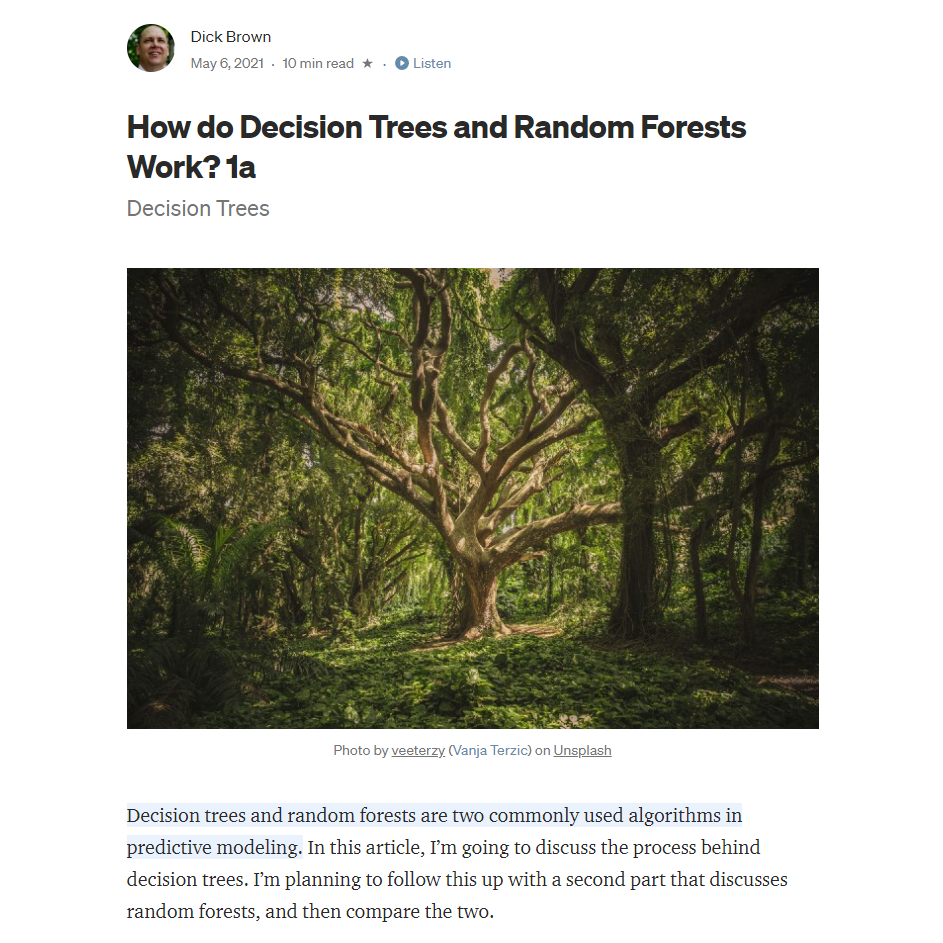
The second article was meant to be the first of a two-part series on decision tree and random forest algorithms. This article describes how the decision tree algorithm works with classification problems. I later wrote second article on regression trees. The random forest article is still pending.
The third article describes the basics of how to create an R package. After searching for how to do this online, most of what I found was either confusing or outdated, so I decided to figure out how to create one and write about it.
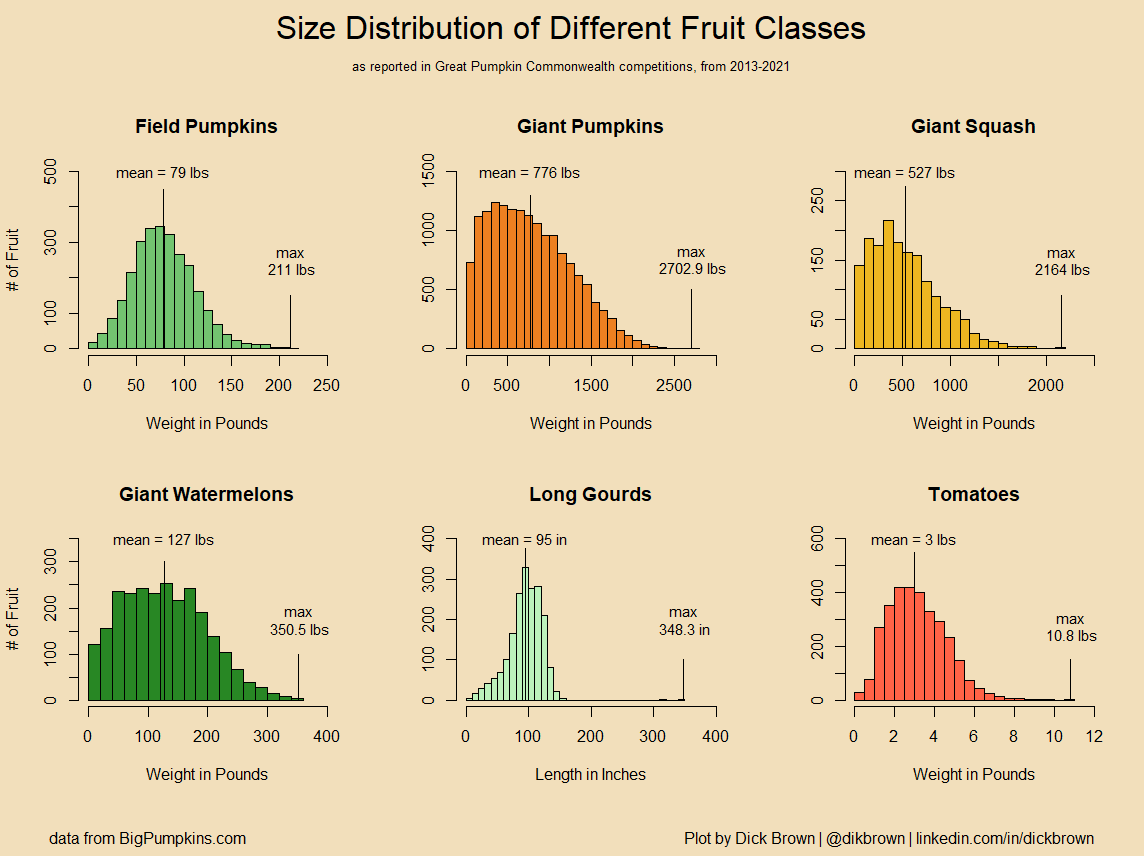
The last article goes over issues related to graphing percentages. This process is trickier than you might think, since it's relatively easy to go all the way from 50% to 90%, but more difficult to go from 90% to 99%, and very difficult to go from 99% to 99.9%. So the normal rule of "start from zero" must often be disregarded.


I have undertaken some exploratory data analysis projects on Kaggle. I decided that the best way to present these projects would be via R Markdown Language. In th
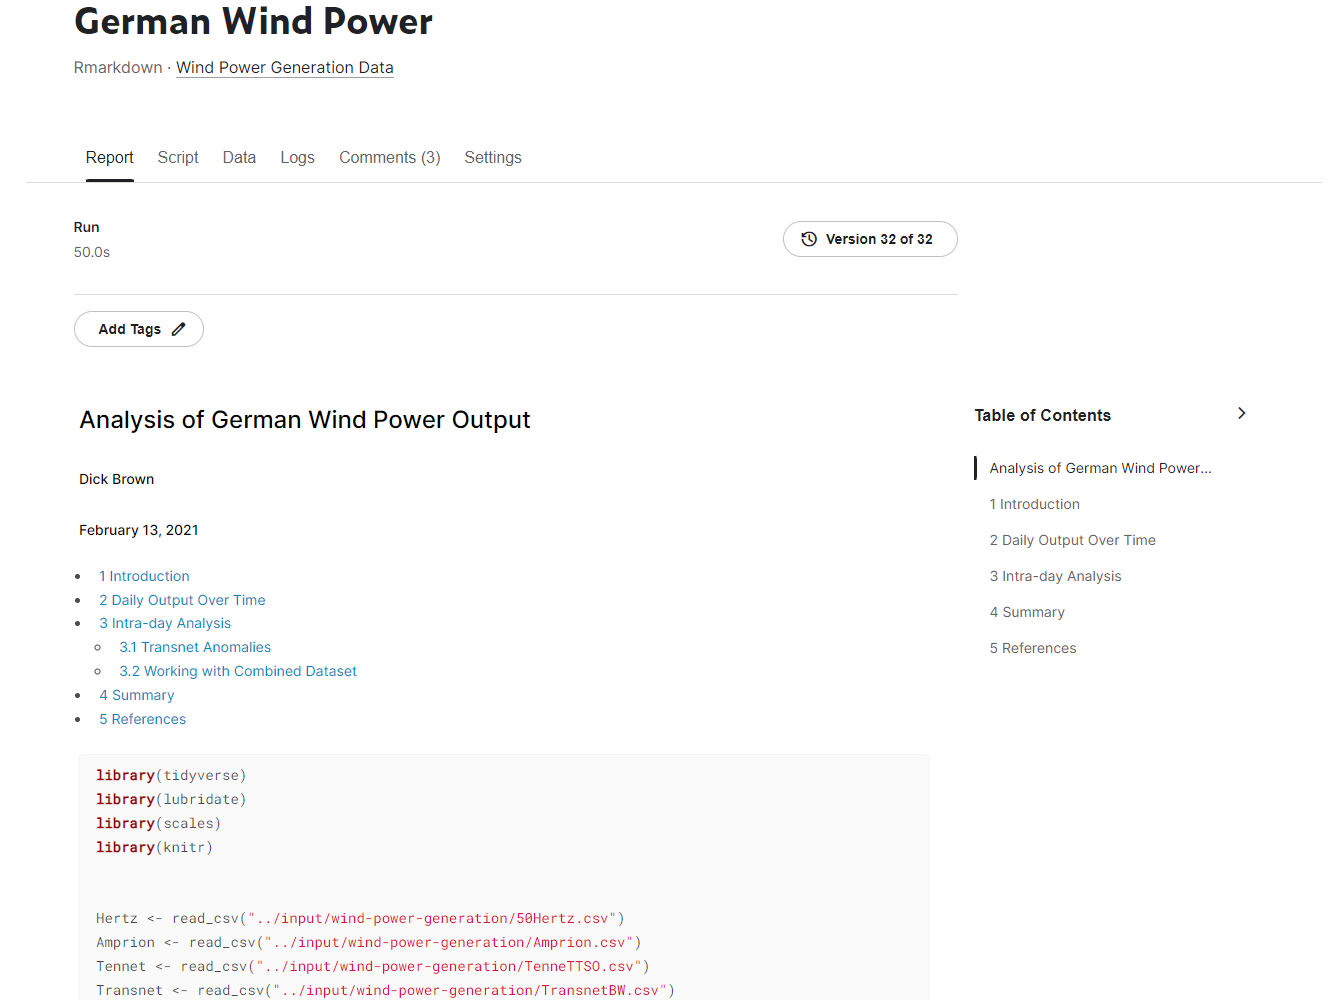
In the first project, I identified an anomaly in a German Wind Power dataset. I initially noticed spikes in mean energy output that were not present in the corresponding median energy output. I was able to determine that this was caused by very high reported energy output on December 2, 2019. Zooming in even further, I found high energy output values every hour, on the hour, on that day, starting at 7 am, and going to 2 pm.
The second project involved a market basket analysis of a groceries dataset. I identified the items purchased the most, along with some association rules for what products tend to be purchased with what other products. Unfortunately, the dataset was quite small, which meant that the rules did not have much lift (comparison of the association with pure chance). Some time-series analysis was performed, to see if there were differences over the course of the week, and over the course of the year.


Drop me a line and we can talk. It can be about a job, or a discussion of the website, or just the start of a beautiful friendship.