Miscellaneous School Projects

This was a three-part project for my Data Visualization class. In the project, we were asked to create three things:
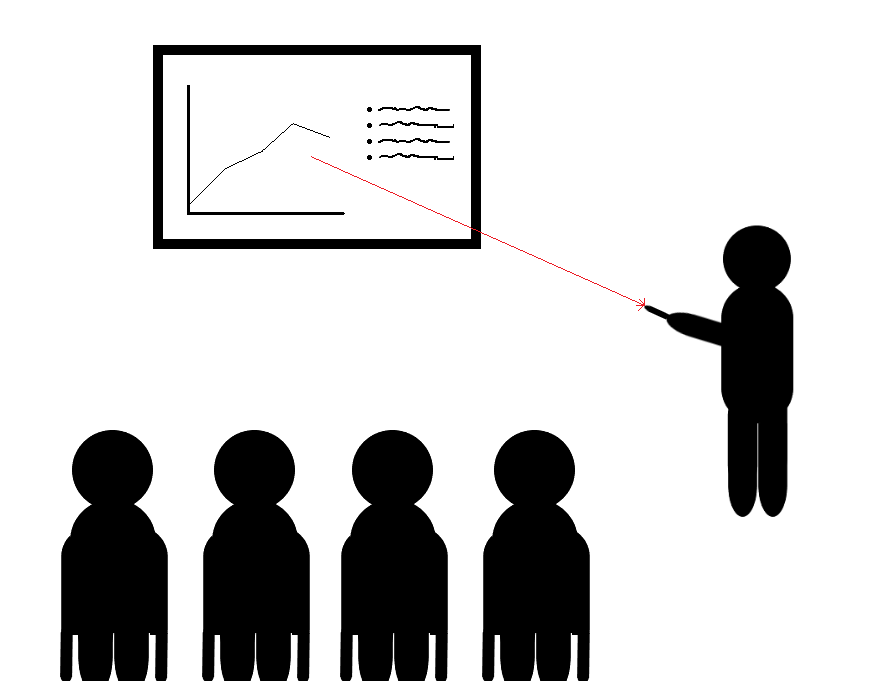
The first part was a presentation to the state budget office to provide data to help the office determine the amount of any monetary reserve and emergency resources to be put into stand-by.
The second part of the project involved creation of a brochure to be made available to the general public regarding weather safety.
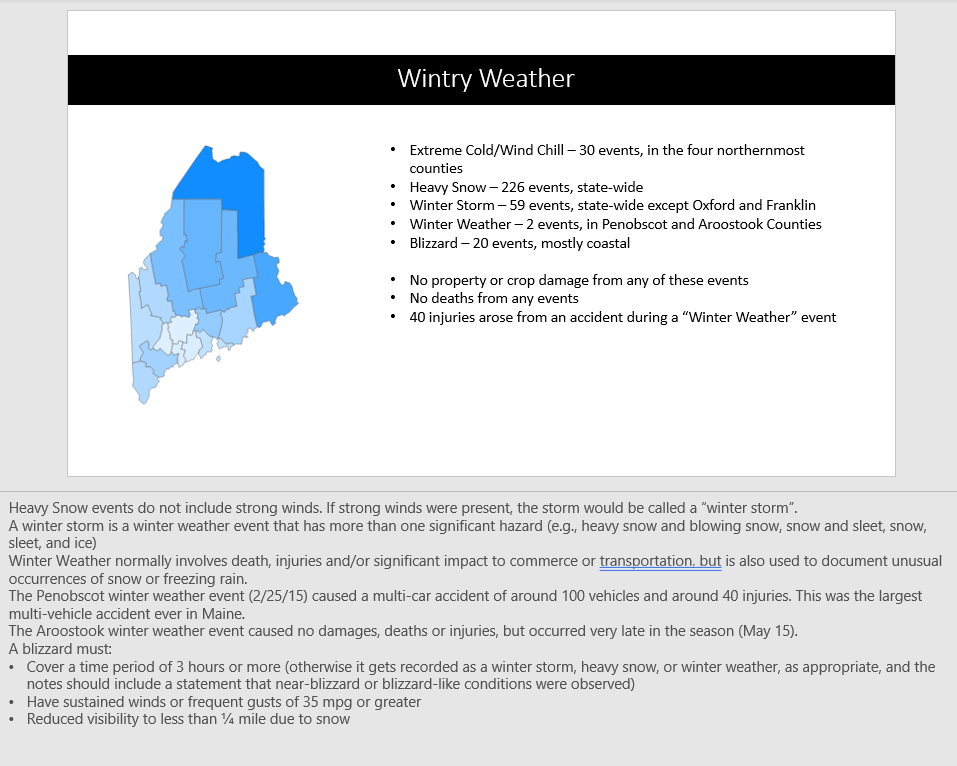
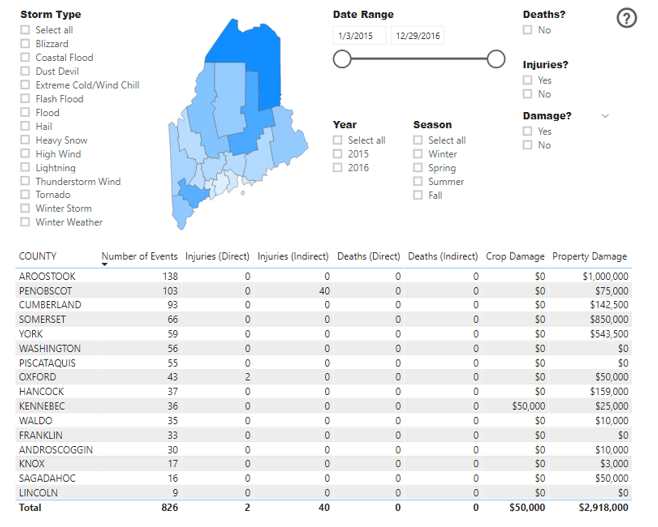
Finally, a dashboard was designed for use by Maine's Emergency Management Agency (MEMA) with Power BI. Ultimately, the purpose of the dashboard was to allow MEMA officials to look up information regarding damage estimates before, during, and after weather events. Since this was intended to be used by MEMA personnel, a User's Guide was also created. Sreenshots of the dashboard are available here. The complete User's Guide can be found here.


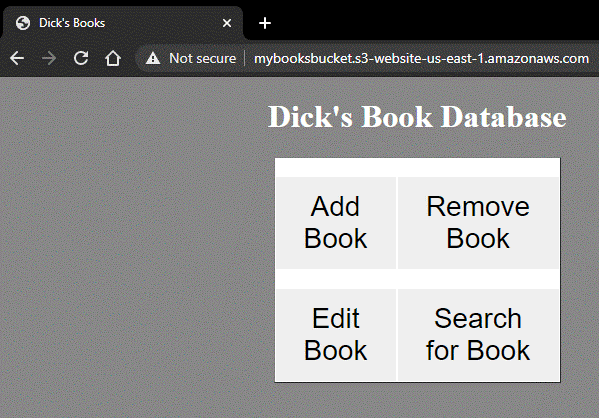
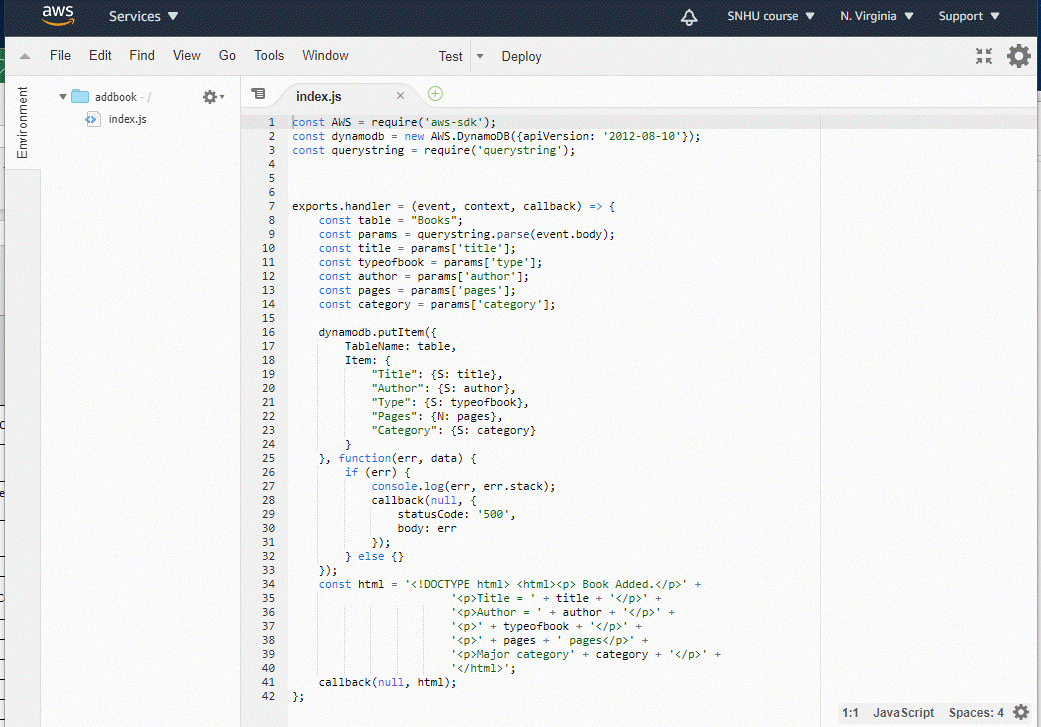
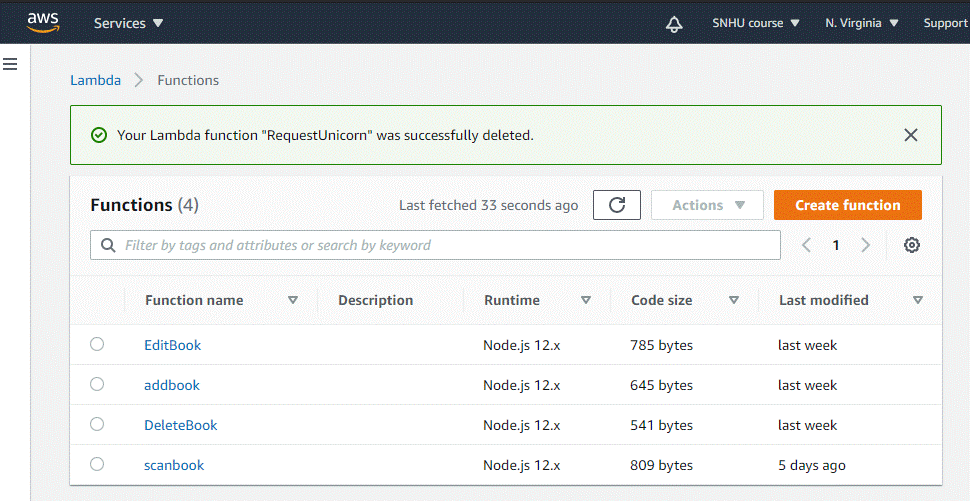
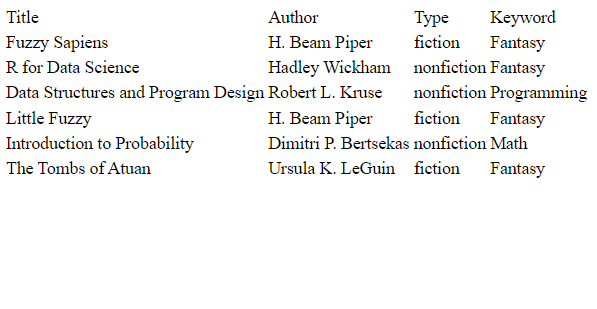
For my class on Amazon Web Services, we were tasked with creating "something" on AWS. I chose to create an online books database, using NoSQL. I used a static web page to call Amazon Lambda functions to interact with the database. The Lambda functions were written in Node.js, which I picked up as I needed it. It's nothing fancy, but it works.
If you would like access to the database to see it in action, drop me a line below.
Drop me a line and we can talk. It can be about a job, or a discussion of the website, or just the start of a beautiful friendship.